

VBelo Model Talk: 2026
The model was good, but it just got better. How did the model do in 2025? What is changing for 2026? Also, let's start the year off with a ton of charts!

The season is right around the corner and there is so much volleyball to talk about. But before the first serve, we need to talk about the engine under the hood. I’ve spent the offseason overhauling the VBelo Model, the math that powers the win probabilities you see in your inbox every morning.
This is the first major update to the model since its inception in 2021. While I’ve made minor tweaks over the years, this is a total rebuild. I am incredibly excited about where the data landed for the 2026 season.
How did the model do last season?
“Picking” Winners
Let’s start with the worst way to judge a model: Did it pick the winner? Technically, that’s not what the model does. It provides a probability. As anyone who watches the MIVA or the Big West can tell you, sometimes the “expected” result doesn’t happen. But that chaos is why we love sports!
However, for those wondering: Of the 928 National Collegiate matches last season, 717 were won by the team with the higher VBelo probability.1 That is a 77% success rate, significantly better than a coin flip and nearly identical to our 78% mark in 2024. But as I’ve said before, “picking winners” is not that helpful; we need to go deeper.
Mean Squared Error: The “Closeness” Metric
To see how good the model actually is, I look at Mean Squared Error (MSE). This is also called the Brier Score. This measures how far off a prediction was from the actual result. We want this number as close to zero as possible.
If the model was essentially a coin flip (50/50 chance), it would have MSE = 0.25. For some context, elite NCAA Men’s Basketball models on Kaggle will score in the 0.15 - 0.20 range.2 Last season, VBelo had an MSE = 0.1439, its best year yet!
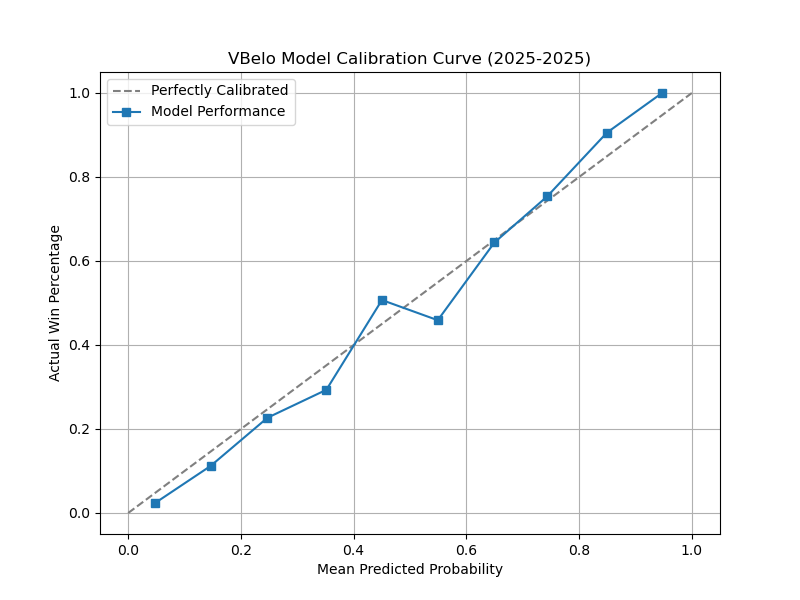
Log Loss & Calibration Curve: The “Confidence” Metric
Even with a great MSE, I knew the model had flaws—specifically in calibration. If the model says a team has a 30% chance to win, they should actually win 30% of the time over a large sample.
This is what the calibration curve for the 2025 season looked like. The line is mostly straight, but there is definitely room for improvement.
In terms of more helpful metrics, there is also Log Loss. Logarithmic Loss measures a model’s accuracy by penalizing confident wrong predictions heavily and evaluating how close predicted probabilities are to actual outcomes. Similar to MSE, a 0 would be perfect.
For some baseline context, a 50/50 coin flip would give you a Log Loss of 0.693 (because logs are weird like that). The NCAA MBB Kaggle models we talked about earlier score in the 0.50 – 0.60 range. The old VBelo model, in 2025, had a Log Loss of 0.4397. This was actually a lot better than I anticipated. When looking at 2021-2025 combined, the Log Loss was only 0.4691!
Compared to other sports models, VBelo is very good. I don’t think it is elite just yet, but it is knocking on the door of being there.3
Ch-ch-ch-ch-changes
If you don’t care about the technical details of the model, feel free to skip to the to the bottom. But if you’re ready for a nerdy, whirlwind tour of the 2026 upgrades, grab a seat. Here is what’s changing:
K Factor Decay
Old: K=60 (constant)
New: K=80 for the first 12 matches, then decaying down to K=40
Why: This helps the model “learn” about teams faster in January and February while preventing established powerhouses from swinging too wildly in April.
Linear Constant
Old: 400
New: 350
Why: With a larger K Factor (and the margin of victory calculation below), the model needed to react less for each match. This helps keep underdogs from gaining too many Elo points from one victory.
Home Court Advantage
Old: +50 Elo to the home team
New: +65 Elo (regular season)/ +100 Elo (postseason)
Why: For starters, the model was vastly under-valuing a home court. Teams were out-performing the model by about 10% with the old home court adjustment. On top of that, home teams in the postseason do even better than the regular season!
Travel Fatigue
Old: -5 Elo per 250 miles (max -25)
New: -1 Elo per 50 miles (max -50)
Why: The idea for this one was right, but it just wasn’t precise enough. The old version didn’t start until a team traveled 250 miles. So, if they traveled 200 miles, there was no adjustment, which didn’t seems right. Also, since some teams travel across the country or into the middle of the Pacific Ocean, the max travel adjustment needed to make sure it captured how difficult it is to travel that far.
Margin of Victory/Point Differential
Old: K/6 * Set Differential/3
New: K * (0.8 * (log(set differential + 1) + point differential factor) * (2.2 / (Elo difference * 0.001 + 2.2)))
Why: In looking back at my code, I don’t fully know what I was thinking here. The calculation for the losing team was always gave points to them if they won at least one set. Apart from fixing that, this one got a lot more complicated. I borrowed a method from FiveThirtyEight (RIP) to create a logarithmic relationship between set/point differential and the K Factor. The result: winning in fewer sets is good, but winning in fewer sets and keeping your opponents to fewer points is even better.4
5 Set Fatigue
Old: None
New: -10 Elo in match following a five set win
Why: This one surprised me. Teams that win 3-2 perform worse in their next game. In fact, the model was 9% worse than expected in these situations. This adjusts for the fatigue, physically and mentally, of going the distance.
Static Elo Ratings
Old: D-III = 1419, NAIA = 1373, New Teams = 1419, Transition to D-I/II = 1419
New: D-III = 1200, NAIA = 1250, New Teams = 1000, Transition to D-I/II = 1300
Why: Since the model actively tracks just D-I/II, it has static Elo ratings for other teams. The old values were based on averages that I took early on. Needless to say, they needed updating. NAIA teams actually do better as a whole over D-III teams, which I did not see coming. Also, the code now differentiates between brand new programs and programs that are transitioning up divisions. This has dramatically helped adjust for the growth that men’s volleyball has seen in recent years.
Season regression
Old: Every team moves 10% closer to 1500
New: 25% closer to 1500 and every conference moves 10% closer to 1500
Why: I have long struggled with what to do between seasons. There was a version of the model that tried to capture returning talent. It was way too difficult to maintain and didn’t actually make the model better. This helps fight Elo inflation while also addressing the strength of different conferences.
That was a lot, I know. This was a very quick tour of the changes to the model. Let me know what you think and what questions you have.
How good is the new model?
Let’s revisit those metrics from the beginning to see how the latest and greatest version of the VBelo Model stacks up against its former self. Spoiler: the new model is the winner.
Mean Squared Error
The only year to see a worse MSE was 2021. Since this was really the beginning of the model, I am not surprised that it is the worst. The sample size is the smallest and every year the model learned more about the teams.
Log Loss
Similar to MSE, we see improvement in Log Loss with the new model. Every little bit helps!
Calibration Curve
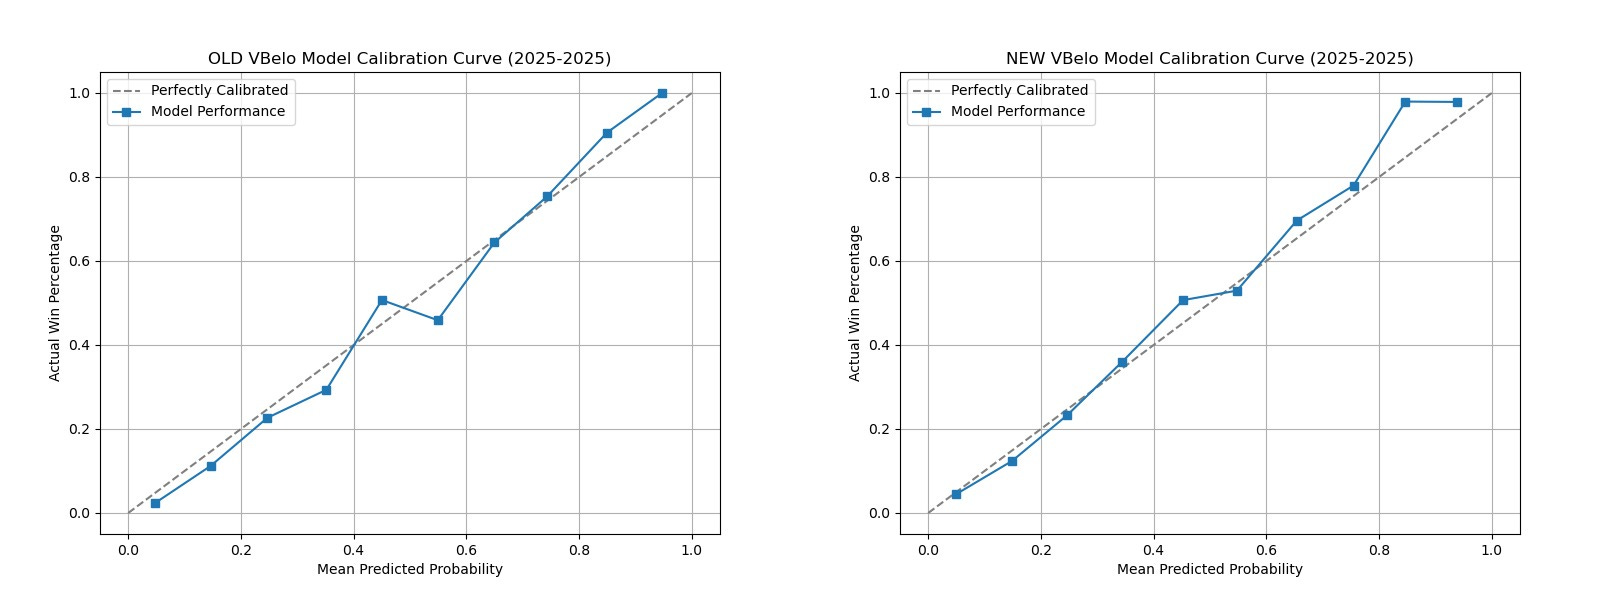
This where things get a little more interesting. The numbers show that the new model is better overall, but is something that looks off about 2025 (top right corner of the right chart). This essentially means that very one-sided matches go to the favorite even more than expected.
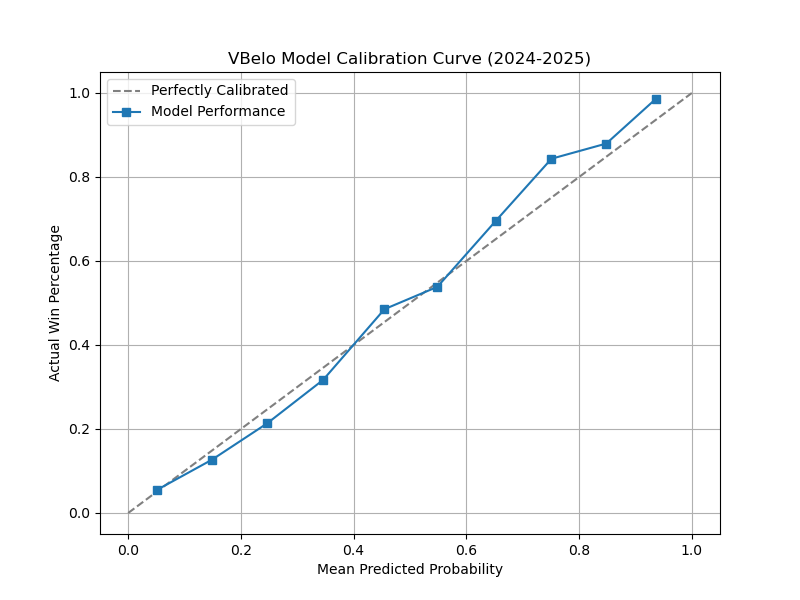
While this one area looks less accurate compared to the previous model, the improvements in the other parts are more than worth it. Also, overcorrecting for one year is not a good idea. When looking at the previous two years in the new model, you can see it is more evened out. This model is build for the long-term, not a one-off season.
Postseason
A quick note here about the postseason. I have been marking matches as “postseason” for years but I haven’t had the model do anything with that information. Finally, the model treats these win-or-go-home matches differently. The impact of the changes to the model for the postseason is huge!
For MSE, the postseason gets the value all the way down to .1391. For Log Loss in the postseason, it went down to .4281. These both lower than the full season numbers which means that the model is even better in the postseason than in the regular season.
Conclusion
New year, new model. It is a thrill to see VBelo performing at this level (especially for a “hobby” project). Whether it’s a top-5 showdown or two emerging D-II programs battling for conference respect, the 2026 season is going to be pure chaos, and I can’t wait to see what the model thinks of it.
See you for first serve on Friday.
I wouldn’t call them “favorites” because close matches don’t really have favorites.
There are several factors that make projecting NCAA Men’s Basketball more difficult than Men’s Volleyball. For starters, there are far fewer teams playing volleyball. Because of this, the parity of competition looks drastically different.
To call the model Elite, I would probably want to see the MSE is in 0.12 range. Not sure if I will get there, but I can dream.
If teams want to improve their elo rating, they shouldn’t make subs in set 3…just saying.
Very interesting way to improve the model. From my POV, the factor of travel is important as many still travel by van, or live in high traffic areas making stress levels higher for all concerned. Not many chartered flights in MVB.
Keep up the great work