

Let there be rankings!
The first look at the 2026 VBelo rankings.

This is probably overdue by this point in the season, but better late than never? Let’s say yes. Today, I want to look at where teams stand at this point in the season. Since we are in the middle of February, the season is about halfway over. But really the second half will be full of matches so we haven’t gotten to the halfway point for matches. Regardless, I think we have a decent look at most teams so far.
Where do these rankings come from?
Let’s start with an important note. These rankings are based on every team’s VBelo Rating. Basically, the more elo points they have, the higher they are ranked. If you are wondering how teams get elo points, the short answer is they win. They get more points if they win by a lot. They get the most points when they beat a team that started with more elo points than them.
At the beginning of the season, I wrote up a nice explainer of the changes to this year’s model which helps explain how teams get elo points.
VBelo Model Talk: 2026

The season is right around the corner and there is so much volleyball to talk about. But before the first serve, we need to talk about the engine under the hood. I’ve spent the offseason overhauling the VBelo Model, the math that powers the win probabilities you see in your inbox every morning.
VBelo Rankings
Okay, I know what you really want are the rankings, so let’s get to them. I have an image of the top 25 as well as a full interactive list.
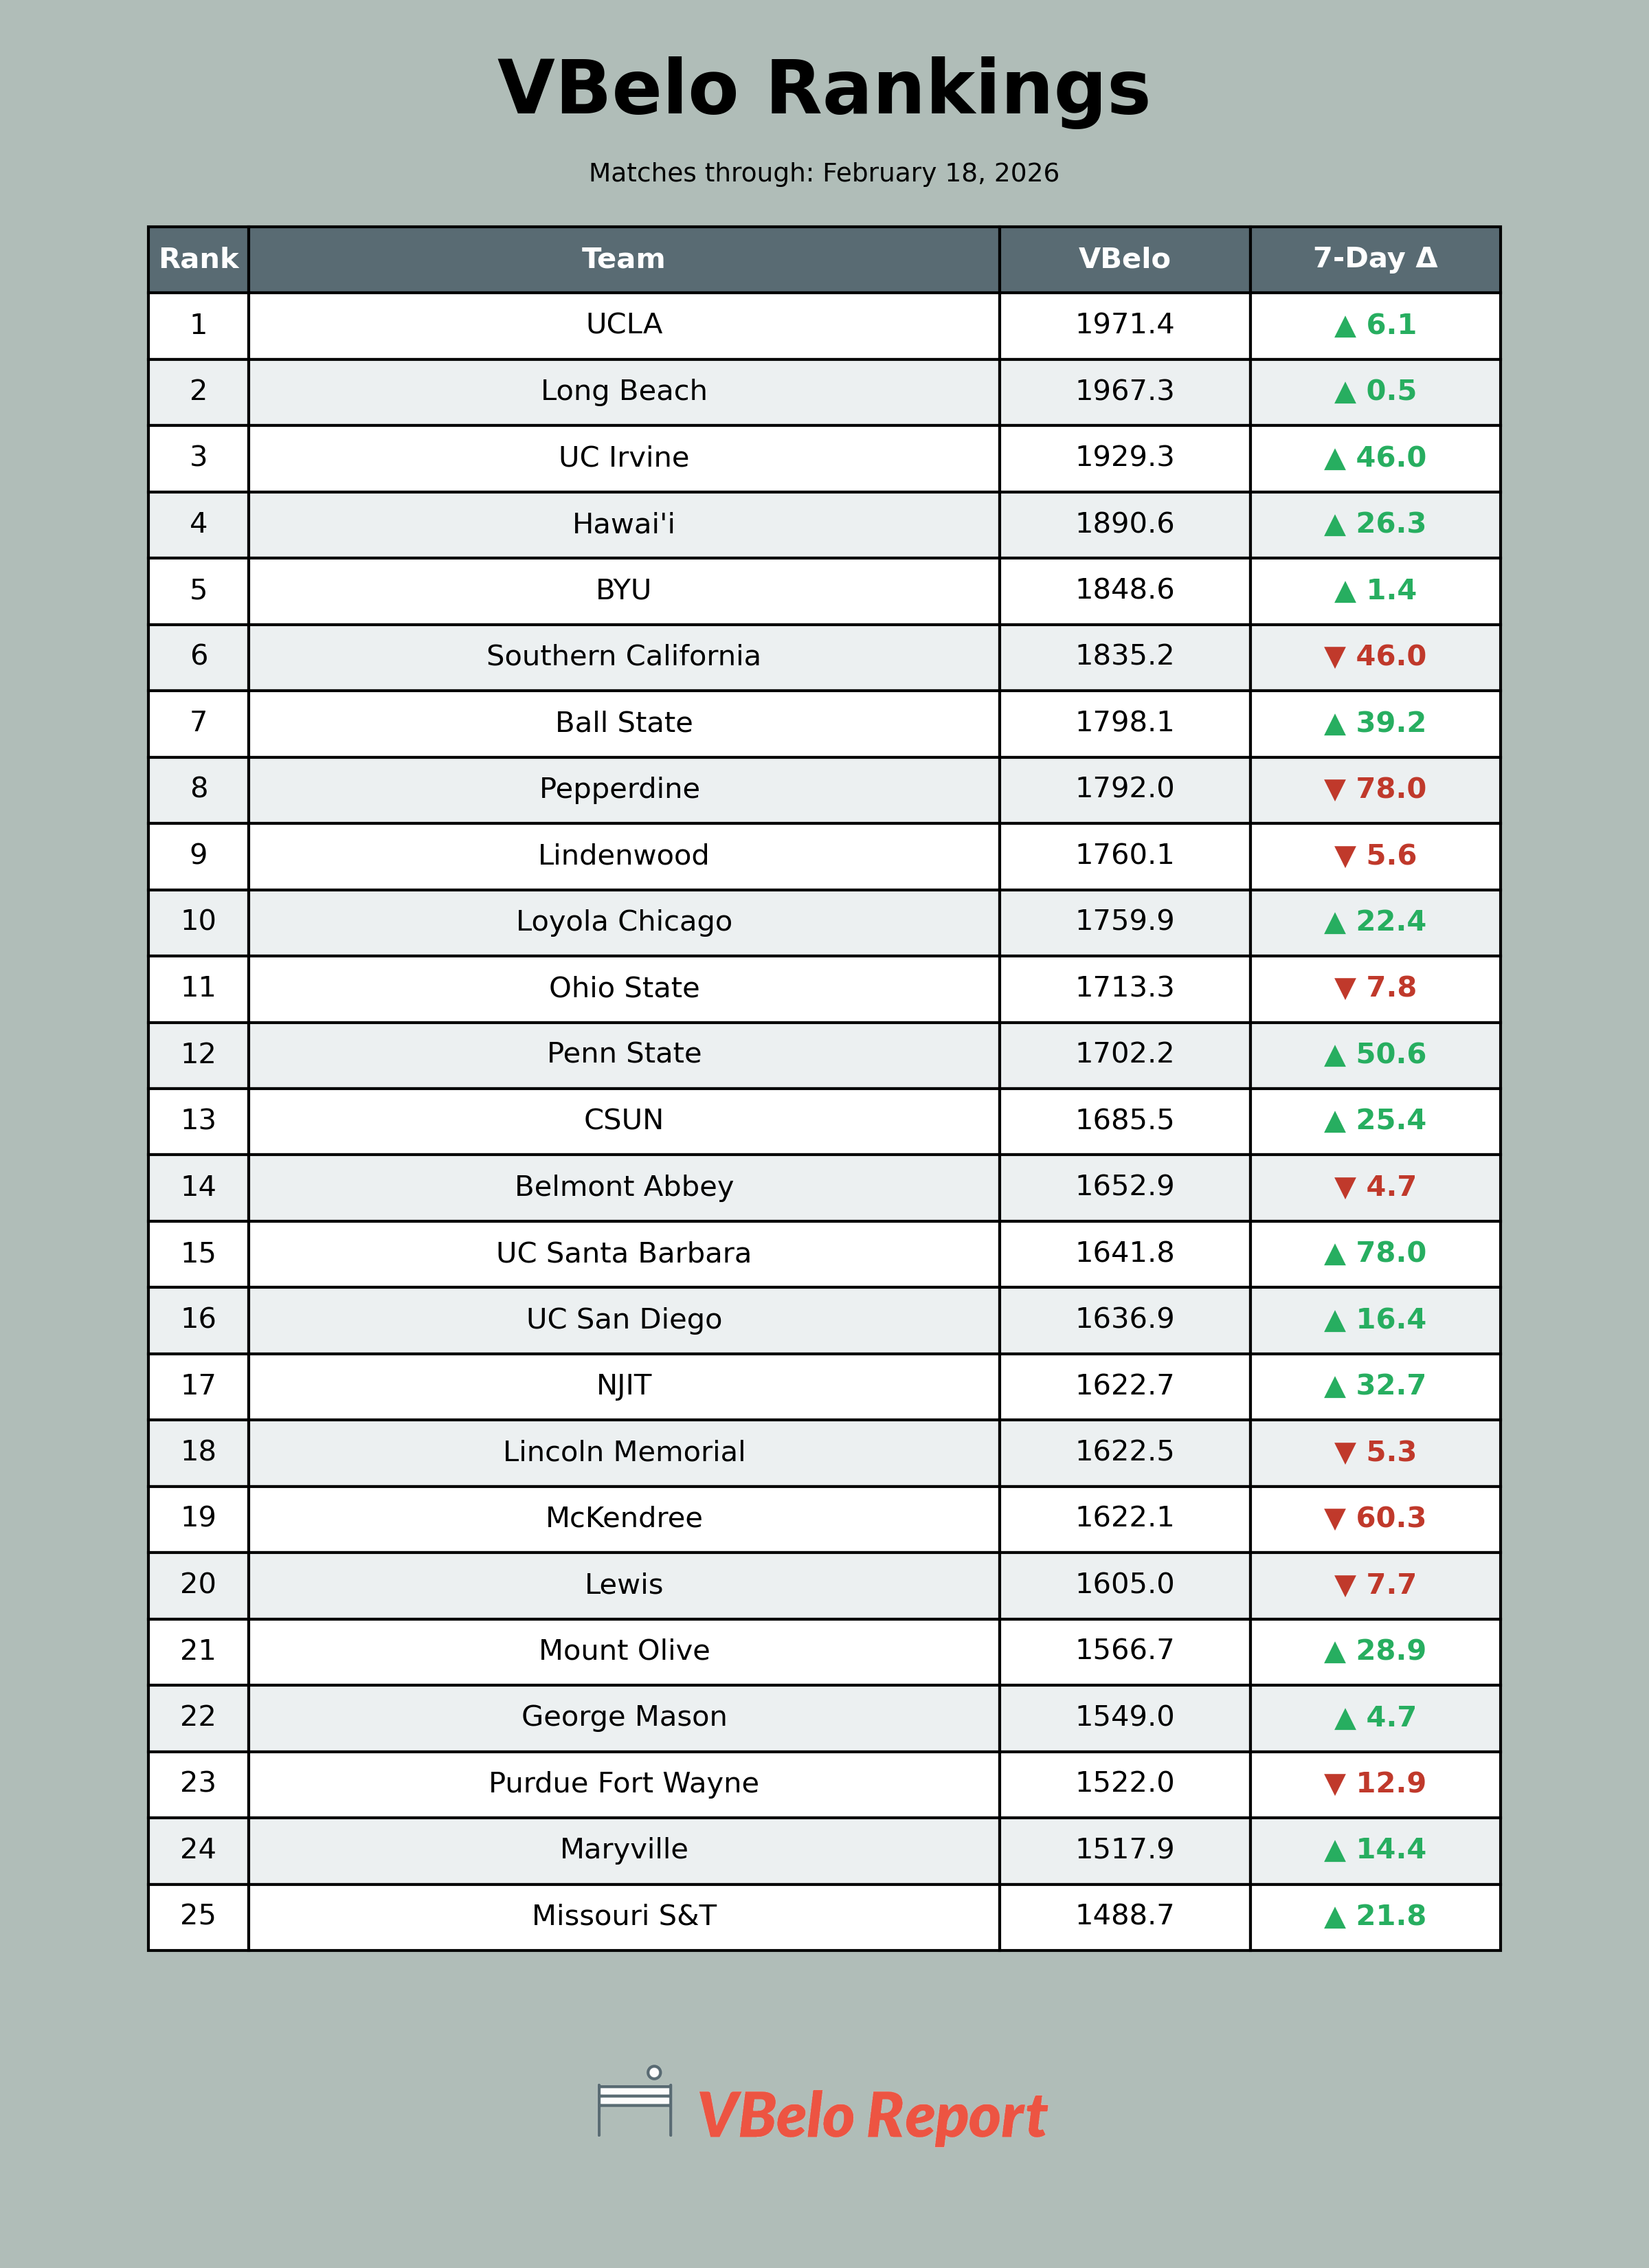
I think this chart is mostly easy to read, but I want to make sure it all makes sense. I think Rank and Team are very self-explanatory. For VBelo, this is a team’s rating. The higher the number, the stronger the team. This is the number that fuels the odds of teams (as seen in all of the daily projection emails). The last column is how a team’s VBelo Rating has changed in the past 7 days. This helps give a sense of how much a team has moved with their most recent matches.
Something I think about often (because I am strange like that) is how to explain how much of a difference these ratings amount to. For teams that are fairly close, every 10 elo points equals about 1.5% in changes of winning. For example, UC Irvine and Hawaii are separated by about 40 points right now. If they played a match in a vacuum (no travel for either team, no home court advantage, etc.), the Anteaters would be favored at about 56%. The 40 points difference turns into 4 x 1.5%.1 The model is more complicated than this, btu this is a good rule of thumb.
Here are the full rankings!
Some quick takeaways
Conference domination - The Big West, MPSF, and MIVA are extremely well positioned. I think we all knew this, but yeah, the tops of these conferences are super competitive.
Championship Rematch - Will we see a rematch of UCLA and Long Beach? They still look like they are the two best teams in the country, but they are (probably) beatable.
GLVC Rising - For a first year conference, having two teams in the top 25, is a good look. I think the future is bright here. It will be very difficult to keep an automatic bid to the national tournament out of their reach for very long.
MIVA Madness - It has already been madness. It will continue to be madness.
Will there be more rankings updates?
Yes. That is the easy question. How often? I am thinking weekly, but I haven’t landed on which day of the week yet. You all will be the first to know. It is important to remember that these ratings will move slower as the season goes on, so don’t expect some gigantic movement. There is still value is what movement we do see, but really this is just one way to view the teams.
There we have it, 2026 rankings. What do you think? What surprised you? What excited you? What disappointed you? What confused you? What made you want to make your own model so that we can compare notes? Let me know!
These are rough estimations. The exact formula isn’t this simple. As the teams get farther apart, you can’t get more than 100% chance of winning. But this method works for teams within a couple of hundred points.
This looks awesome! Glad to have a place to see all teams, not just ACVA top 20. Thank you for making this.
I do think that USC being low will be a surprise but their SOS is weak at the moment.
Stanford Princeton not being in the top 25 may shock some as well.
Nice job